Whether you are looking for a little test bed or an always-on home dashbording system, the RaspberryPi is a great, affordable platform for the TIG-Stack. So let’s ride through all the necessary steps ‘From Zero to Awesome’ in less than one hour.
Raspberry Pi – Bootstrap
In my experience, a RasperryPi 3+ B with 1 GB RAM is sufficient for most use cases. You will need a reasonable sized and fast SD-Card with 16-32GB or, even better, a M.2 NMMe SSD drive.
Image Download
- Download and install the Raspberry Pi Imager based on your workstation OS.
- Choose Raspberry Pi OS Lite under OS (other)

- Write the image to your SD-Card
- The imager ejects the SD-Card, you might want to re-mount it by physically removing and re-inserting it for the next step.
Headless Startup
There is no need to connect a keyboard and monitor for the first startup. Just create a new empty file named ssh in the boot partition of the SD-Card to activate the ssh daemon. This also prevents challenges related to the keyboard layout, where y and z might be reversed and the default password contains a y …
Now plug the SD-Card into your Pi, connect an Ethernet Cable to your network and power it up. It grabs an IPv4 address via DHCP and should be reachable via ssh after 2-3 minutes due to the initial SD-Card partitioning. Depending on your router the Pi pops up as raspberrypi under connected devices, or the corresponding IP has to be discovered via the ARP table, using the following vendor OUIs of the MAC address:
- B8-27-EB-xx-xx-xx (until Pi3)
- DC-A6-32-xx-xx-xx (Pi4)
The default credentials are
- Username: pi
- Password: raspberry
Raspberry Pi – SSD Detour

An external SSD for storage is a very good idea because an SD-Card has limited performance and might wear off very fast when used with a time series database like InfluxDB. As the USB connection is the limiting factor, even the cheapest M.2 (NVMe) SSD is sufficient.
Raspberry Pi 3
To enable booting from USB storage simply edit the /boot/config.txt file by entering the following command to your ssh session.
pi@raspberrypi:~ $ echo program_usb_boot_mode=1 | sudo tee -a /boot/config.txt
The USB SSD needs to be flashed via the Raspberry Pi Imager with the same image as the SD-Card before and is now the default device at the next boot time. If you desire to run your Pi without the SD-Card you might tweak the /boot/config.txt once again, to prevent the CPU from pointless burning cycles while searching for the SD-Card.
pi@raspberrypi:~ $ echo dtoverlay=sdtweak,poll_once | sudo tee -a /boot/config.txt
Raspberry Pi 4
The fairly new Pi4 doesn’t support USB boot like the Pi3, it still needs the boot partition on the SD-Card and some hacks, as it’s somewhat picky about the USB adapter. So I recommend the outstanding blog post by James Chambers to stay tuned about the development on that front.
Raspberry Pi – Basic Configuration
Some basic configuration steps after the first login via ssh, based on Raspbian 10 Buster release.
Change User Password
pi@raspberrypi:~ $ passwd
Changing password for pi.
Current password:
New password:
Retype new password:
passwd: password updated successfully
pi@raspberrypi:~ $
Change Timezone
pi@raspberrypi:~ $ timedatectl list-timezones | grep Berlin
Europe/Berlin
pi@raspberrypi:~ $ sudo timedatectl set-timezone Europe/Berlin
Update All Packages
pi@raspberrypi:~ $ sudo apt update
...
pi@raspberrypi:~ $ sudo apt upgrade -y
...
This might take a while … time for a coffee break.
[optional] Change Hostname
pi@raspberrypi:~ $ sudo raspbi-config
Choose 2 Network Options and N1 Hostname to change the hostname.
[optional] Change DHCP to static IP
pi@raspberrypi:~ $ sudo nano /etc/dhcpcd.conf
Uncomment and adjust the following lines.
# Example static IP configuration:
interface eth0
static ip_address=192.168.0.10/24
#static ip6_address=fd51:42f8:caae:d92e::ff/64
static routers=192.168.0.1
static domain_name_servers=192.168.0.1 9.9.9.9
Write to disk, quit the nano editor and reboot.
pi@raspberrypi:~ $ sudo reboot
TIG-Stack – Installation
This installation instructions cover Raspbian version 10 / Buster. Since the official Debian repositories lag behind, the vendor repositories from InfluxData and GrafanaLabs will be used
to install the TIG-Stack.
curl -sL https://packages.grafana.com/gpg.key | sudo apt-key add -
curl -sL https://repos.influxdata.com/influxdb.key | sudo apt-key add -
echo "deb https://repos.influxdata.com/debian dists buster stable" | sudo tee /etc/apt/sources.list.d/influxdb.list
echo "deb https://packages.grafana.com/oss/deb stable main" | sudo tee /etc/apt/sources.list.d/grafana.list

sudo apt-get update
Now that all the repository lists and their dependencies are up to date, the actual installation can happen, followed by enabling and starting the services.
sudo apt-get install -y grafana influxdb telegraf

sudo systemctl enable influxdb grafana-server telegraf
sudo systemctl start influxdb grafana-server telegraf
That’s it. The successful start can be verified via sudo systemctl status telegraf.service , or influxdb.service, or grafana-server.service.
TIG Stack – Basic configuration
And now to the configuration section, all credentials have to be changed – of course.
InfluxDB
This creates a database named telegraf with four weeks retention and a user telegrafuser with password Telegr@f to access this database.
pi@raspberrypi:/etc/influxdb $ influx
Connected to http://localhost:8086 version 1.8.0
InfluxDB shell version: 1.8.0
> create database telegraf
> use telegraf
Using database telegraf
> create user telegrafuser with password 'Telegr@f' with all privileges
> grant all privileges on telegraf to telegrafuser
> create retention policy "4Weeks" on "telegraf" duration 4w replication 1 default
> exit
Telegraf
To send first local agent data to the InfluxDB, just uncomment and/or alter the following sections of the central Telegraf configuration file.
pi@raspberrypi:~ $ sudo nano /etc/telegraf/telegraf.conf
[[outputs.influxdb]]
   urls = ["http://127.0.0.1:8086"]
   database = "telegraf"
   username = "telegrafuser"
   password = "Telegr@f"
Telegraf needs a reload to read the new config, and it is wise to check the status of the service for errors.
pi@raspberrypi:~ $ sudo systemctl reload telegraf.service
pi@raspberrypi:~ $ sudo systemctl status telegraf.service
At this point Telegraf starts to push data to the InfluxDB, here is a quick way to verify that something has been written to the database.
pi@raspberrypi:~ $ influx
Connected to http://localhost:8086 version 1.8.0
InfluxDB shell version: 1.8.0
> use telegraf
Using database telegraf
> select * from system limit 5
name: system
time host load1 load15 load5 n_cpus n_users uptime uptime_format
---- ---- ----- ------ ----- ------ ------- ------ -------------
1594650963000000000 raspberrypi 0.39 0.47 0.65 4 1 13350 3:42
1594650973000000000 raspberrypi 0.33 0.46 0.63 4 1 13360 3:42
1594650983000000000 raspberrypi 0.35 0.46 0.63 4 1 13370 3:42
1594650993000000000 raspberrypi 0.59 0.48 0.67 4 1 13380 3:43
1594651003000000000 raspberrypi 0.5 0.47 0.65 4 1 13390 3:43
Grafana
Now to the final step, the basic configuration of Grafana.
Open the following URL in your webbrowser: http://IP_RASPBERRYPI:3000 to reach the login screen.
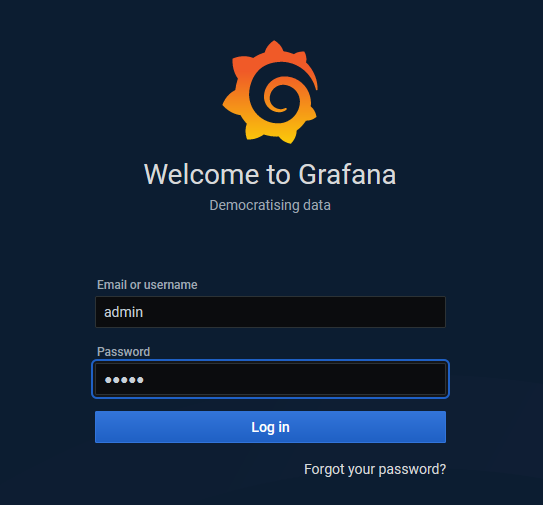
The default credentials admin / admin must be changed at first login.

Time to Add your first data source with the following parameters:
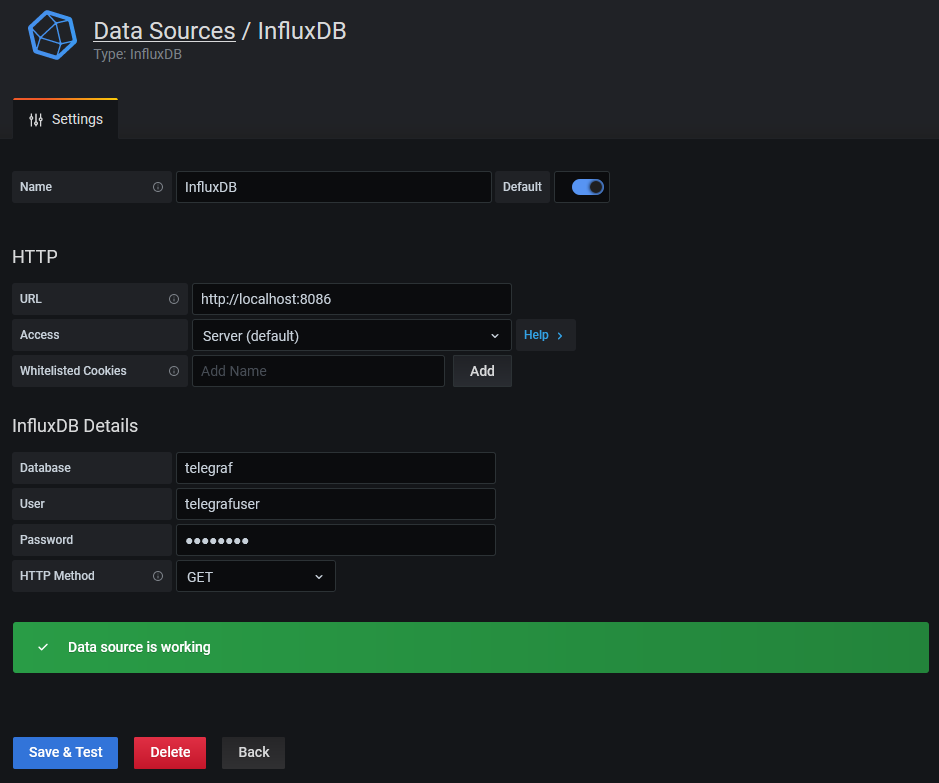
A click on the Grafana symbol at the top left brings back the main screen.
At this point the TIG-Stack is ready to be used. Telegraf is pushing some default system metrics of the RaspberryPi to the InfluxDB and Grafana can query the database. You can start to discover the possibilities and build own dashboards from here, or follow the last section and import a preconfigured one.
TIG-Stack – RaspberryPi Dashboard
Jorge de la Cruz shared a very nice RaspberryPi host metrics dashboard which can easily be consumed via the Grafana hub. A few additional adjustments are necessary to read the network and temperature metrics.
Telegraf configration
pi@raspberrypi:~ $ sudo usermod -a -G video telegraf
This adds the Telegraf user to the Linux group video to gather information about the GPU.
To complement the Telegraf configuration, better use the /etc/telegraf/telegraf.d directory and create a new file named raspberrypi.conf. Telegraf reads every file ending with .conf in this directory when reloaded, making it very easy to structure and maintain the overall configuration. Or to automate device onboarding via your favorite config management solution by the way, because it’s very easy to templatize those configuration files.
pi@raspberrypi:~ $ sudo nano /etc/telegraf/telegraf.d/raspberrypi.conf
[[inputs.net]]

[[inputs.netstat]]

[[inputs.file]]
   files = ["/sys/class/thermal/thermal_zone0/temp"]
   name_override = "cpu_temperature"
   data_format = "value"
   data_type = "integer"

[[inputs.exec]]
   commands = ["/opt/vc/bin/vcgencmd measure_temp"]
   name_override = "gpu_temperature"
   data_format = "grok"
   grok_patterns = ["%{NUMBER:value:float}"]
It’s possible to validate the new configuration, fully isolated from the running Telegraf agent:
pi@raspberrypi:~ $ telegraf --test --config /etc/telegraf/telegraf.d/raspberrypi.conf
2020-07-13T16:43:27Z I! Starting Telegraf 1.14.5
(...)
cpu_temperature,host=raspberrypi value=53154i 1594658607000000000
gpu_temperature,host=raspberrypi value=53.7 1594658607000000000
Looks good, so another Telegraf reload commits the new configuration.
pi@raspberrypi:~ $ sudo systemctl reload telegraf.service
Grafana Configuration
Now back to the Grafana frontend. To add the first dashboard, mouse over the + just below the Grafana Search at the main page and choose Import. Enter the ID 10578 and Load.

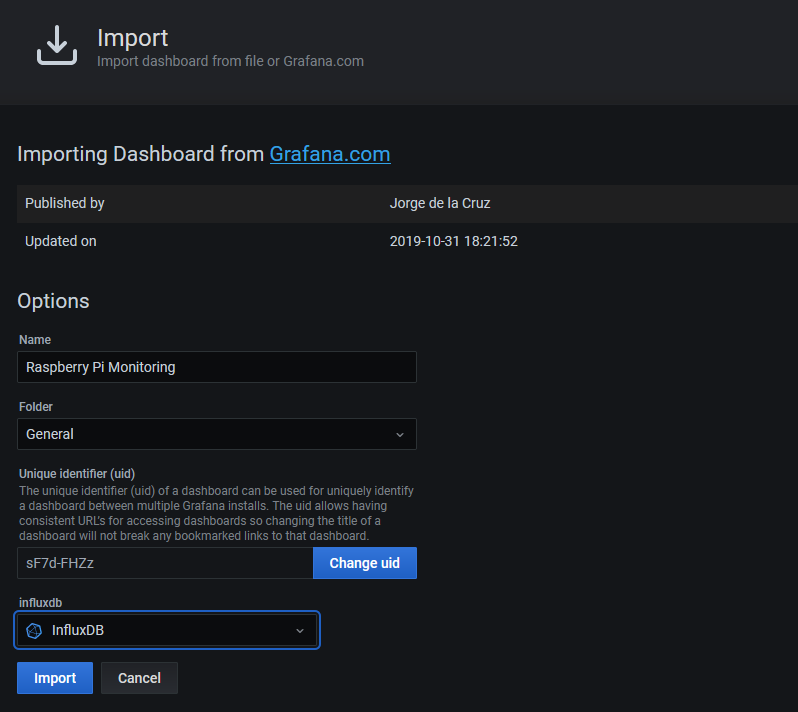
The Datasource has to be the default InfluxDB and after Import the new Dashboard pops up.

Closing
So wow, you managed to stay to the end of this. I have definitely violated my ‘maximum of 1000 words per post’ rule. Anyway, I hope it was worthwhile and you are now the proud owner of an excellent monitoring platform. This is only the beginning of your journey 😉

Thank you very much for the detailed instruction
Thanks a lot for sharing this!! It really worked nice and easy! I’ll try harder to create my own dashboards on Grafana, it’s a very powerful tool.
Very comprehensive tutorial! Thank you very much! 🙂
thanks, thats a fantastic tutorial!
Absolutely superb tutorial. I’ve been using my own TIG stack for a year now to monitor my central heating system and it’s been brilliant at providing insights into boiler issues etc.. and it’s totally reliable too. This tutorial pulls together into one concise page what took me weeks to work out for myself. Great work and thanks for sharing it.
Great job. Very easy to follow. Thank you
Thanks for sharing this great tutorial.